Showing posts with label rain. Show all posts

Saturday, October 5, 2013

Imagine the Common Laser Pointer Delivering Drinking Water!

Local precipitation of water vapor in the air to produce rain (when needed and in necessary amounts) would be a god-send to humanity. Most common approaches so far have been ways to "seed" condensation of the water vapor in the air. Recent research has, however, surfaced the possibility of using lasers to promote condensation.
Traditional "Seeds" of Condensation
Dry Ice
Source - en.wikipedia.org
Silver Iodide crystal
Source - en.wikipedia.org
Dispersing tiny particles of dry ice, silver iodide and other salts is the traditional approach to seeding clouds to encourage precipitation in the form of rain.
The efficiency of this approach is, however, a bone of serious contention because the success of this approach is never predictable to any level of acceptable confidence.
Laser Filaments
A Laser Filament
Source - large.stanford.edu
A narrow column of plasma is known as a laser filament.
A Laser Filament
Source - large.stanford.edu
A column of plasma forms when a laser pulse self-focuses and when its self-focused intensity is high enough to ionize the medium the pulse is traversing through. At this point in time and location, the column of medium is actually a column of plasma aka a laser filament.
As the energy required for continued ionization detracts from the pulse energy, the filament steadily dissipates over time.
Air is as medium for laser beam propagation and, thus, for the formation of filaments.
Typical filaments are a few meters long but filaments with lengths in the hundreds of meters are not uncommon.
Inside a Laser Filament
HNO3
Source - ffden-2.phys.uaf.edu
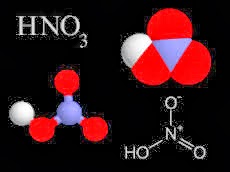
The local chemical composition of the atmosphere appears to be altered by the existence of a laser filament.
In particular, at relative humidity levels higher than 70%, the HNO3 amounts inside a laser filament are found to be over 1,000 times the levels at which HNO3 is known to stabilize water droplets, increase their growth and increase their rate of growth.
The most interesting finding from experiments is that this higher concentration outlives the laser filament by orders of magnitude i.e. the water-producing effects of increased concentration can continue to make water droplets larger for as long as 15-20 minutes.

The eventual result: rain!

Saturday, June 22, 2013

Water is a Renewable Resource because Air Exists!

The Earth's atmosphere is key to the Earth's water cycle. Without the atmosphere, Nature's  engine of delivery of a constant supply of water safe for drinking and irrigation all over the world, could not exist or function as it does and has for a very very long time.
The Atmosphere
Water Exists in Atmosphere
Source - op.gfz-potsdam.edu
All the water in the atmosphere is concentrated in the atmosphere near to and touching the ground.
It is from this atmosphere that water precipitates in its many forms - rain, snow, hail etc - down to the ground, with assistance from a combination of forces that include gravity, temperature variations, variations in the content of particles and bacteria in the atmosphere, etc.
Without the atmosphere, water would not move around as smoothly as it does today. And, maybe, it's renewable ability would be at risk if the atmosphere disappears or reduces in volume.
How much atmosphere is there?
Total volume of atmosphere
and all Water (safe and unsafe)
Source - Science Photo Library
Actually, not that much more than water!
If we represent the total volumes of water (1.4 billion cubic kilometers) and air as spheres:
- The water sphere would be 1,390 kilometers in diameter. Of course the safe water part of this sphere is miniscule.
- The air sphere would be 1,999 kilometers across.
Half of the air lies in the first 5 kilometers above ground level which contains 90% of the miniscule safe water in the atmosphere.
Running out of safe water
The key question that arises on running out of safe water is: What is the probability that we might run out of air?

Saturday, February 16, 2013

Rainfall Predictions Possible With Cell Phone Technology

Knowing how much rain falls on a location is key to determining if any unfilled thirst remains unfilled at that particular location. Unfortunately, however, knowing actual rainfall amounts has always been a very difficult task.
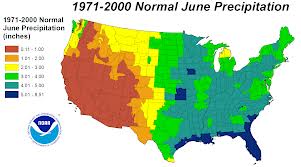
Typical Precipitation Map
Source - climatecentral.org
Resolution of data that makeup such a map is, at best, around 50 miles and is possibly as high as 100-200 miles. This data is gathered from rain gauges installed every 50, 100 or larger distances apart.
We are, however, very well aware that rainfall amounts are not usually similar or identical over a 50 mile or a 100 mile or a 200 mile square of area.
Using rainfall data from this map can lead to incorrect conclusions: thirst experienced by some farms can be overlooked, or, some farms that don't experience thirst can be targeted for additional water supply. In either case, resources expended to deliver water (safe for irrigation) will end up being misspent.
Radar Maps
Source - weathercentral.com
Doppler radar have better resolution that do rainfall data maps.
However, the installed base of Doppler radar sites are predominantly around major cities and population centers. Doppler radar, thus, provides us with high resolution rainfall maps in and around cities.
Farms or other remote agricultural locations have few of these radars and thus assessing their thirst is a problematic task
Towers (for mobile phones) may hold the answer!
For cell phones to work, microwave transmissions are relayed between individual towers. 
These microwave signals, between towers, are transmitted at a known constant strength that allows for signal decay over distance and for known weather conditions that might reasonably be anticipated. For a particular weather condition, the rate at which this signal falls off (or deteriorates) can be predicted for any set of towers.
When liquid water is in the air (i.e. it is raining), however, the signal between towers drops (is weaker) because a part of the signal is reflected off raindrops and does not make it to the next tower.
Depending upon terrain, towers can be just 1-2 miles apart.
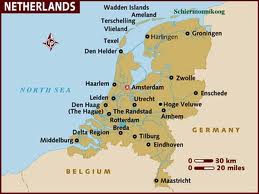
The Netherlands Experiment
Source - lonelyplanet.com
Netherlands, the country, has just 32 rain gauges, but about 8,000 mobile phone towers.
An algorithm has been developed that measures differences between normal (no rain) signal strength and signal strength when it rains.
An experiment was run, in September 2011, to see how well signal monitoring could measure actual rainfall amounts.
This test, conducted with data from just 2400 cell towers, mapped rainfall amounts very close to the measurements from a combination of radar and rain gauges.
Thirst in the Developing and Underdeveloped worlds As cell phones, and the towers that enable them, have become commonplace all over the developing and underdeveloped world, its a simpler step to use cell phone signals to measure and predict rainfall amounts in real time. The traditional alternative, involving radar and rain gauges, may not be necessary any more.

This post was inspired by an article in The New Scientist magazine

Saturday, September 1, 2012

Freshwater's Supply Chain is Unlike that of Any Other Resource!

Freshwater is a resource like no other. While differences between freshwater and other renewable and non-renewable resources are many, freshwater's supply chain makes freshwater a most unique natural and renewable resource. Nature delivers freshwater in ways it doesn't do for any other resource. 
Freshwater's Current 3-Source Supply Chain
Source - willoughby.nsw.gov.au
3 sources of freshwater exist for most human settlements. These are:
1. Rainwater that naturally falls on the settlement
2. Freshwater transported from near and far locations  to the settlement, and
3. Locally obtained water, usually from a combination of sources located at ground level (e.g. rivers and lakes) and below ground (e.g. wells that tap the local water table).
Some locations do not, of course, have all 3 sources available to them -  but most do, because this 3-source approach was seen as the most prudent and dependable one.
Threat's to the 3-Source Supply
All three sources can be threatened today in a variety of ways for human settlements in different locations:
1. Climate change has impacted the frequency, amount and location of rainfall.
2. The ability to bring water from remote locations is threatened by both dwindling resources at the remote location and the assertion of communities along the transportation route to the freshwater being transported.
3. Continued extraction of groundwater has lowered water table levels, in some cases to depths that are difficult to access.
Rainfall - Resource delivery on a near-regular schedule
Source - diswaterdrams.com
Other than freshwater, nature delivers no other natural resource on a fairly regular schedule to locations where the resource may also be ingeniously available in bulk. 
Delivery of freshwater as rain was probably of little value while humans were migrating all over the globe. Rainfall's value only became evident about 10,000 years ago, when humans chose to settle down in one place (and grow the food they needed) instead of moving around in search of food. Humans, in a sense, became dependent on rainfall at the start of the agricultural age.
Rainfall Dependency
Once reliant on rain to grow their food, humans became subject to the impacts of any change in rainfall delivery frequency, amount or location. And it is, in large part, this dependency that is shaping a crisis in freshwater supply - supply of rain is simply too undependable.
The one unique feature that defines freshwater delivery is today the one unique force behind freshwater scarcity and water security.


Saturday, April 28, 2012

Lot's of Freshwater, But NOT WHERE It's Needed

Precipitation, commonly called rain, the predominant source of freshwater, is more than enough for a 10+ billion human population plus the other species and nature's ecosystems that must have freshwater.
Rainfall
Source - countryofsb.org
From the very beginning, rain has supplied the freshwater needs of human, other species and nature's ecosystems in two ways: 
- Either, by dropping manna-from-the-heavens directly onto crops and where the freshwater was needed and/or 
- Replenishing lakes and other bodies tapped by humans, other freshwater species and nature's freshwater ecosystems.
Total Rainfall on land
Source - sciencemag.org
A total of 98,500 cubic kilometers of rain is estimated to fall on land every year.
This liquid precipitation is in addition to the 12,500 cubic kilometers that fall as ice and snow on land.
Ignoring for a minute that this rainfall in not geographically uniform and that it has extreme spacial and temporal variations, the 98,500 cubic kilometers/year
= 270 cubic kilometers/day
As 1 cubic kilometer = 264 billion US gallons,
the average rainfall of 270 cubic kilometers/day
= 71,280 billion US gallons/day
For a 10 billion human population (the projected human population in 2050), this rainfall
= 7,128 US gallons per day.
Why Freshwater Scarcity?
Ignoring freshwater accessed over long distances from surface bodies (lakes, rivers, etc) and underground aquifers, with so much rainfall available per person per day, why do we have scarcity anywhere in the world?
The answer: Scarcity is the result of rainfall not being uniform all over Earth's land mass and the unpredictable spacial and temporal variations of rainfall.

Saturday, April 7, 2012

Every Water Is Not The Same!

We all are quite familiar with the salty taste of ocean water compared to water deposited by rain and water streaming out of a faucet. Another difference may help us tap on-demand, the oldest freshwater source on Earth.
The Ocean in the Atmosphere
The hydrologic cycle maintains and continuously replenishes a vast ocean of freshwater in the air closest to the ground. This ocean is the source of all rain and snow, the dew we find deposited on our cars, dew deposited on the ground early in the morning and the moisture that appears on the outside of a cold glass. 
Isotope Hydrology
Change in isotope content during the hydrologic cycle
Source - ANTSO.gov.au
It is an established fact that water from different sources contains different number and types of isotopes.(see post dated Oct 15, 2011).
Isotope Hydrology is the new science that uses existence of isotopes to estimate age and origin of water in each stage of the hydrologic cycle.
What makes Isotope Hydrology most interesting is that it can map a "local" hydrologic condition to include an identification of the the origin and content of water in the local atmosphere.
Predicting & Catalyzing Precipitation
The primary cause of freshwater scarcity is continued lack of rain where and when we humans want and need it. Precipitation (mostly rain) directly waters our food crops, adds runoff to increase river flows and lake levels, and replenishes ground water reservoirs.
We could soon produce rain on-demand using Isotope Hydrology that can accurately measure the isotopic content of local air, compare it to conditions that produce rain and identify what changes are necessary to produce rain on demand anywhere on Earth!

Saturday, March 10, 2012

Water Resources impacted by Climate Change?

Implications of climate change on the Earth's Hydrologic Cycle are slowly coming into focus but the underlying phenomenon are still not well understood. Any assessment of climate change impact on water supplies are, thus, only our attempt to err on the 'safe' side for humanity and nature's ecosystems.


The Greenhouse Effect
Source - ucar.edu
If the greenhouse effect can be attributed to a single event, this event happened in 1988. Scientists, seeking to explain a series of unusually warm years, were able to link for the first time in 1988, the increase in atmospheric temperature to the retention of long-wave radiation (received in sunlight) in the atmosphere. Further research linked this increase in retention to an increase in greenhouse gasses that include Carbon dioxide, water vapor, nitrous oxide, methane and chlorofluorocarbons.
(As addition of carbon dioxide fuels increase in all the greenhouse gases, we are developing ways to reduce human carbon dioxide emissions)
Predicting Climate
We all know too well how difficult it still is for us to predict tomorrow's weather. 
Our difficulty is simply due to our lack of understanding on how the vast number of processes and their feedback cycles, come together to make the weather we experience.
Climate Change
As we don't really know how to predict the impacts of climate change, we have developed the approach of trying to understand (and model) historical data on temperature rises and the amount of greenhouse gases in the atmosphere. So, using the historical record as a 'given' we are measuring the increase in amount of greenhouse gases to assess what climate we should expect
Pinpointing Impacts of Climate Change
Climate change is expected to cause rapid changes in temperature, precipitation and concentrations of greenhouse gases (water and Carbon Dioxide). To predict the direction of these changes (i.e. will the result be a flood or a drought?) we make models to represent nature's complex ecosystems. The conclusions we reach are only as good (i.e. as closely representing the functioning of the ecosystem) as the models we can make.
Keeping in mind that our conclusions on the impact of climate change on water resources is only as good as the models we make, 

Rainfall is THE Concern
Source - loadstorm.com
Numerous computer model-based assessments have raised concerns of BIG changes in the amounts of rainfall.
  • In high latitudes areas (in equatorial Africa and Asia, in Southeast Asia) annual rainfall is projected to dramatically increase, while in mid-latitudes and in most subtropical regions rainfall is expected to decrease. 
  • A general reduction in precipitation of snow is expected to reduce the amount and duration of snow cover
Additional implications of reduced or unanticipated rainfall can also be postulated:
  • If we pollute more and more water, less rainfall implies that the concentration of pollutants in our water supply will remain higher longer
  • As we use an enormous volume of water to generate electricity and cool thermal power plants, any reduction in rainfall will only increase pressure on water supplies
  • Current levels of irrigated food production will have inadequate amounts of irrigation water (for example, in the dry US West) leading to reduction in food supplies - some studies predict a drop in USfood production by 30% for a 3 Degree Centigrate increase in air temperature.
  • And ..........
Maybe, the solution is to develop ways to extract both water vapor and carbon dioxide from the atmosphere!!


Saturday, March 3, 2012

Water Defines Climate Everwhere

Water in the troposphere, the atmosphere closest to the surface, conditions the Earth. In some locations water runs the local heating system while, at the same time, it acts as the cooling system in other locations. Water has an inordinately strong effect on climate. 


What is climate?
Climate Map
Source - blueplanetbiomes.org
Climate is weather averaged over a long period of time, usually, 30 years.
In this averaging, weather is defined by many variables. The predominant variables are temperature, precipitation and wind movement.


Temperature
Air Temperature Variations
Source - griffin.uga.edu
Temperature is a measure of the 'heat' in any location.
This 'heat' is the sum of the amount of energy deposited on a place by sunlight and the amount of energy existing on Earth at that place.
Water in the atmosphere and in surface bodies acts as the controller of heat distribution around the planet.
Water in the wind moves heat from one location to another.
Ice sheets and clouds cool the Earth's surface by reflecting the heat energy back into space.
Ocean and river currents transport heat to locations far and near.


Precipitation
Source - valdosta.edu
Precipitation IS water - in every form that water exists!


Water's Venetian Blind effect
Source - b4i.ie
Water in the air (with other greenhouse gasses like carbon dioxide) acts in much the same way as slats in a Venetian blind. 
The angle of each slat influences how much of the suns' heat and light enters a room. We can move the slats to form a 'closed' surface to, in effect, stop most light and heat from entering a room. We can fully 'open' the blinds to allow entry of the most amount of light and heat into a room.
In a similar way, nature manipulates the water content of air at individual locations (in conjunction with other parameters) to influence (raise and lower) in a very large way the temperature at a particular location.

Saturday, October 15, 2011

Oxygen Isotopes and The Water Cycle

Water molecules tagged with different isotopes of oxygen have different tendencies to evaporate and condense.


Isotopes
An Atom
Source - antonine-education.co.uk
 
An element is defined based upon the number of protons contained in its atoms i.e. different elements contain different number of protons in each atom.
With the number of protons being the same, the atoms of an element can contain a different number of neutrons. 
Isotopes are atoms of the same element or compound that differ in the number of neutrons contained in their atoms.


Oxygen Isotopes
8N and 10N Isotopes of Oxygen
Source - mhhe.com
The Oxygen atom has 15 isotopes of which 3 are stable while 12 are unstable (radioactive) with very short half-life. These unstable isotopes have variants, defined on their mode of decay, that increase their number beyond 12.
Stable oxygen Isotopes
Source - web.sahra.arizona.edu
The 3 stable oxygen isotopes have 16, 17 and 18 neutrons in the nucleus of each atom. 
The 16-Neutron isotope is the most abundant - 99.762% of all Oxygen atoms have 16 neutrons in oxygen atoms.


Primary and Secondary Isotopes of Oxygen
The 16-neutron oxygen isotope is known as the primary isotope as it is postulated to have been created by stellar evolution. The 17-neutron and 18-neutron isotopes are called secondary isotopes because their existence requires "seed nuclei" and they are created on earth.


Oxygen Isotopes and the Hydrological Cycle
Isotopes in air, ocean and ice
Source - wwnorton.com
Water molecules are tagged with the different atoms of oxygen. Thus, water molecules can be tagged with oxygen isotopes with either 16 or 17 or 18 neutrons.
Source - eesc.columbia.edu
Glacial ice, the oceans and the vapor in the air, all contain water molecules tagged with the most common 16-neutron isotope. However, concentrations of the 16-neutron isotope are different in ice, oceans and air. This difference is ultimately due to the slightly higher tendency to evaporate, of water molecules tagged with the 16-neutron oxygen isotope.
Oxygen Isotopes and the Water Cycle
Source - web.sahra.arizona.edu
Conversely, there is a slightly higher tendency of water molecules to precipitate (condense) that are tagged with oxygen atoms containing 18 neutrons.
In fact, the different isotopes of oxygen in water molecules seem to influence evaporation and condensation.


Harvesting of moisture (precipitation i.e. rain) contained in air and wind can, thus, be stimulated by the 18-neutron oxygen isotope that can be artificially created.