Saturday, September 7, 2013

Freeze Sea-Water to Convert it into Freshwater?

As sea water freezes, dissolved salt is excluded, and the resulting ice has much less salt in it compared to sea water. Repeated recycling between solid and liquid can eliminate virtually all the salt in sea water.
Salt content of different waters
No water is totally free of salt. Sea water has a typical salinity of 3.5%.
Water salinity based on dissolved salts
Fresh waterBrackish waterSaline waterBrine
< 0.05%0.05% – 3%3% – 5%> 5%
Crystal Structures
Ice and salt crystals have very different structures in solid form:
Crystalline Structure of Ice
Source - ps.uci.edu
Crystalline structure of  Salt
Source - webelements.com
Ice has a hexagonal (six-sided) structure while salt has a cubic (four-sided) structure. It is primarily due to this structural differences that salt and water separate during the freezing process.
The Freezing Process
As pockets of sea water start freezing, the crystalline structure of frozen water begins to appear which pushes salt molecules away to produce water pockets rich in salt (aka brine solution). As the salt-free water freezes, the brine solution resists freezing because its high salt content has lowered its freezing temperature.
As ice freezing continues, this brine solution, essentially, leeches out from the water crystals leaving behind water whose salt content is much lower than that of sea water.
Freezing speed, if fast enough, can trap some salt molecules inside ice crystals but these are gradually released as ice crystals reach for their steady state.

Saturday, June 29, 2013

Is Any Place FREE from Potential Safe Water Risk?

Water risks come in many forms and if "amount of safe water" is used as a measure, then too-much water (flood) is one extreme while too-little water (drought) is the other extreme. Other measures that define risk are quality, limitations imposed by nature or constraints imposed by a lack of water supply infrastructure.
Flood Risk
Water Risk - Flood Occurrence
Source - http://aqueduct.wri.org/atlas
World Resources Institute's AQUEDUCT Project has mapped the occurrence of floods in the 1985-2011 period. Some interesting observations:
- The Eastern half of the US has experienced many floods; Much of Western Australia has had to cope with floods; Floods seem to cover all of South Asia and the Middle East excluding countries that have predominantly desert landscapes; Mid and Eastern Africa have needed to cope with floods; etc.
Areas free of foods include:
- Mid and south-western US; Much of Canada; Northern regions of Russia and the Scandinavian states; Southern tip of Africa; Midsection of Australia; etc.
Drought Risk
Water Risk - Drought Severity
Source - http://aqueduct.wri.org/atlas
Another map from the AQUEDUCT Project displays drought locations during the 1985-2011 time period. Some conclusions: Australia's midsection and west experience drought; The US west coast and western states are drought prone; Northern and southern Africa have experienced drought frequently; Canada's midsection will see drought as will north and northeastern Russia; The Scandinavian areas free from floods have seeen many droughts; etc
Combining Risk of Flood and Drought
A most interesting and ominous conclusion surfaces when the two maps, flood history and drought history, are superimposed: there seem to be very very few areas where water, as drought or flood, does not pose a hazard to humanity and, also, nature:
- Much of Australia, the US, Africa, Europe, Russia, the Middle East. Canada, etc have been prone to risks from water, either as drought or as flood.

Safe water is a worldwide issue! Very very few of us will not face some form of water insecurity in the near future. We are all in the same boat where safe water is concerned!


Saturday, June 22, 2013

Water is a Renewable Resource because Air Exists!

The Earth's atmosphere is key to the Earth's water cycle. Without the atmosphere, Nature's  engine of delivery of a constant supply of water safe for drinking and irrigation all over the world, could not exist or function as it does and has for a very very long time.
The Atmosphere
Water Exists in Atmosphere
Source - op.gfz-potsdam.edu
All the water in the atmosphere is concentrated in the atmosphere near to and touching the ground.
It is from this atmosphere that water precipitates in its many forms - rain, snow, hail etc - down to the ground, with assistance from a combination of forces that include gravity, temperature variations, variations in the content of particles and bacteria in the atmosphere, etc.
Without the atmosphere, water would not move around as smoothly as it does today. And, maybe, it's renewable ability would be at risk if the atmosphere disappears or reduces in volume.
How much atmosphere is there?
Total volume of atmosphere
and all Water (safe and unsafe)
Source - Science Photo Library
Actually, not that much more than water!
If we represent the total volumes of water (1.4 billion cubic kilometers) and air as spheres:
- The water sphere would be 1,390 kilometers in diameter. Of course the safe water part of this sphere is miniscule.
- The air sphere would be 1,999 kilometers across.
Half of the air lies in the first 5 kilometers above ground level which contains 90% of the miniscule safe water in the atmosphere.
Running out of safe water
The key question that arises on running out of safe water is: What is the probability that we might run out of air?

Saturday, June 1, 2013

Heracles' Way to Slay the Hydra of Freshwater!

Thinking of the Problem of Freshwater (i.e. the problem ranging from too little to overwhelming amounts of water safe for drinking and irrigation) as "a Hydra to be slain" - see blog post titled: The Problem of Safe Water - The Lernaean Hydra - can point us in the direction of a solution.
Heracles' Slaying of the Lernaean Hydra
Heracles' Slaying the Hydra
Source - wikipedia.org
After attempting to kill the Hydra with arrows and clubs, Heracles is said to have begun to chop off its heads.
Each chopping off, of course, produced two replacement heads to Heracles' dismay.
Upon reflection, Heracles is reputed to have focused on the single vulnerability of the Hydra: It was vulnerable only if it had one single remaining head. Removal of the last head would definitely kill it.
So how to stop heads from multiplying? Heracles did what we are so familiar with: He sought out individuals (Greek gods, of course, as this is a story from Greek mythology) who might have the knowledge to stop heads from growing back.
Heracles and Lolaus Slay the Hydra
Source - wikipedia.org

Seeking One with Special Knowledge
As the story goes, Heracles' sought out Lolaus, his nephew, who delivered the idea to cauterize each neck stump right after Heracles' chopped off each head.
Obviously, Lolaus had enough knowledge himself about using a firebrand to scorch each remaining neck stump or knew where to get it.
Constellation Hydra
Source - urnich.edu
Eventually, with Heracles cutting off each head and Lolaus cauterizing the stump, the Hydra was soon down in heads to its last head. This too got cut off by a golden sword in Heracles' hands.
For those of us that miss the Lernaean Hydra, the serpent can be found in the night sky as the Constellation Hydra where Hera, placed the biologically dead Hydra.
The moral from Heracles' and the Lernaean Hydra
Seek out someone with the special or specific knowledge that can help get the task done. Even when the task involves renewable heads?
This is the lesson that humanity could stand behind for over 200 years and one that  H.G.Wells so famously enumerated in his book titled "Outline of History"  and a lesson that helped humanity overcome the problem of freshwater time and time again through the ages.

Saturday, May 25, 2013

The Problem of Safe Water - The Lernaean Hydra?

Could Greek mythology's water serpent, the Lernaean Hydra, be is an excellent model to define our problem of Safe water aka freshwater?
The Lernaean Hydra
Lernaean Hydra
Source - eaudrey.com
The Hydra was the guardian of the Underworld and lived beneath the waters of a lake, the Lake of Lerna. It was shaped like a serpent with its heads its unique feature: It had multiple heads and would grow two heads for every one head that was cut off. One of the Hydra's heads was called the Immortal Head because it could not be cut off.
Heraces
(silver sculpture from the 1530s)
Source - wikipedia.org
Heracles (Hercules, to us) was charged with the task to kill the Hydra. He initially tried cutting off individual heads but saw two new heads replace those he chopped off.
Eventually he did figure out a way to kill the Hydra. Maybe, Heracles' solution shows us the way to solve the problem of safe water - more on this in the next blog post.
Constant Amount of Freshwater Precipitation 
Precipitation in rain, snow and other forms is the only act of nature that makes safe drinking water (aka freshwater) a renewable resource.
Annual Precipitation
Source - http://hypertextbook.com/facts/2008/VernonWu.shtml
The aggregate global annual freshwater precipitation has stayed more-or-less constant over time - it has never changed in an amount that might give us reason to classify freshwater as a nonrenewable resource! 
Variability in annual amount is not significant by any measure.
Whatever action humanity may take, this cycle of aggregate precipitation continues unabated. So there would conceivably not be a water problem at all unless we are missing something
India precipitation change
Source - delayedoccilater.wordpress.com
Changing precipitation patterns
Change in US precipitation
Source - meted.ucar.edu
Change in Africa precipitation
Source - scrippsblogs.ucsd.edu
This missing something is variability in local rainfall, snowfall and other deposits of freshwater i.e. the variability in aggregate precipitation at any single location. 
The problem of safe water is, thus, characterized in the changes that surface when we examine local changes in precipitation patterns.
How is the Problem of Freshwater a Hydra?
Our global precipitation amount is the body of the Hydra that doesn't change while the heads are the local problems that are as many as places where people live and work - a new factory needs additional safe water but may end up polluting a local stream from where we used to get freshwater; a city grows in population that requires the city fathers to build a new aqueduct to transport safe water from hundreds of miles away; simply look at any local community for its future vulnerabilities to its existing safe water supplies!
Like the Hydra of Heracles, our Hydra of freshwater supply grows a new head - usually too many multiple new heads - whenever local precipitation levels change beyond humanity's ability to counter that change with a compensating change in demand.
The Challenge of Safe Water
Humanity's ability to cope at the local level with the variability of nature's continuously renewed safe water supply is our primary challenge that can rip apart the foundations of our societies everywhere in the world, once again, in the 21st century.

Saturday, May 4, 2013

The Darker a Cloud the Stronger the Rain!

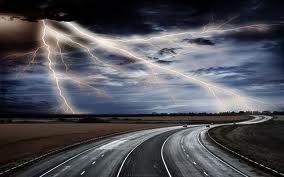
We all know from experience that the darker a cloud the stronger the rainstorm it will produce. 
Cloud Color and Rain Amount
Dark Clouds
Source - wallpapersget.com
From experience we know that there is a very strong correlation between the color of a cloud and the amount of rain it produces:
- the darker a cloud, the more rain we expect to get
or,
- the lighter (with the lightest being the whitest) a cloud the less rain likely.
Particulate Density
All clouds contain particles.
Light Scattered by Particles
Source - http://www.cas.manchester.ac.uk
When sunlight passes through a cloud it gets scattered by these particles.
The more light scattered the less light emerges from the bottom of the cloud - the bottom is what we see and use to describe the cloud as a dark one or a light one.
Light scattered by a cloud
Source - tutorvista.com
Water Droplets and/or Ice Crystals
In addition to particles, clouds contain water droplets and/or ice crystals. These droplets and crystals also disperse the sunlight that falls on the cloud from above. As the density of these droplets and crystals increases, less and less sunlight is able to penetrate the cloud. This lack of penetrations darkens the color of the cloud.
So what we know from experience is true: The darker a cloud, the stronger the rain falling from it because it contains more water droplets and ice crystals

Saturday, April 27, 2013

Rain and Snow from Cloud Seeding

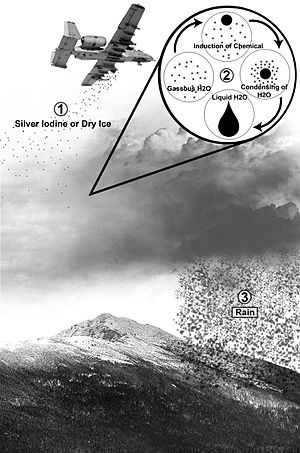
Cloud seeding is done to increase precipitation in areas where extreme drought or long-term scarcity conditions exist.
Typical inorganic seeding nuclei
Cloud Seeding
Source - en.wikipedia.org
Most seeding procedures use inorganic particles or artificially produced organic particles.
AgI Molecule
Source- axcessbio.com 
Silver Iodide (AgI) is a commonly used inorganic condensation nuclei.
Dry Ice (solid Carbon dioxide) is another inorganic nuclei commonly used.
Artificial Precipitation Process
Precipitation Process
Source - en.wikipedia.org
For rain to fall upon demand i.e. for artificial cloud seeding to work, the air needs to contain super-cooled water. Super-cooled water is liquid water colder than zero degrees Celsius.
Silver Iodide has a crystalline structure very similar to that of ice and it is assumed that existence of this structure induces freezing temperatures that convert water vapor into super-cooled liquid water.
Dry ice achieves the super-cooling effect by its expansion that in turn super-cools water vapor.
Rainmaking using silver iodide or solid carbon dioxide both require existence of liquid droplets in super-cooled air.
These initially miniscule liquid droplets serve as the base for liquid and ice droplets to grow to a size large enough that they end up falling to the ground.
Cloud Seeding Goal
Lots and lots of rain is the goal of cloud seeding. Humanity cannot, however, capture much, if any, of this rain and, typically must wait for hydrological processes that add this artificially produced rainwater to existing reservoirs of liquid water that are water is being drawn water from.
Obviously, cloud seeding is an option for supplying multiple acre-feet of water rather than the few liters each individual requires.  

Saturday, April 6, 2013

Cotton Fabric That Absorbs Water From Air?

We know that moisture in the air is 2% in liquid form and 98% in vapor form. This ratio improves a bit - by another 1% or so - in favor of liquid water when a mist or fog rolls around.
For some reason, humanity has continued to focus on capturing the liquid water in air while there is no research on capturing the water that exists as vapor.
Now word comes of a new polymer that does just that.
What's a polymer?
A Polymer (multiple copies of the same unit
Source - ec.europa.eu
Covalent Bond
Source - en.wikipedia.org
A polymer is a compound whose structure is characterized by copies of the same units connected by covalent chemical bonds. A polymer, thus, is a collection of a number of copies of the same unit. 
The covalent bond is the sharing of two electrons between a carbon and a hydrogen atom that each contribute one electron to the coupling.
The New Polymer PNIPAAm
PNIAAm cotton fabric
Left (closed structure at high temperatures)
Right (open structure at low temperatures)
Source - Endoven University
Researchers at Netherland's Endoven University of Technology and at Hong Kong Polytechnic University have together created a new polymer they call PNIPAAm.
When this polymer is applied to cotton fabric, like a cotton shirt, the resulting combination is much more absorbent of liquid water from the air, than is the cotton alone.
The combination can absorb as much as 340% of the cotton weight of water. Cotton alone absorbs about 18% of its weight of water.
Key area of continuing research is the temperature at which the combination starts absorbing and releasing water and building actual clothing to check how the results from the test-beds pan out.

Saturday, March 30, 2013

Water - A Flavor Enhancement Tool!

Whisky gets consumed most often after water has been added in either liquid or solid (i.e. ice) form. In fact, whiskey drinkers most always have a rigid preference of how water is added to their drink.
Water 'opens up' the Aroma
Source - toonvectors.com
For aroma to be present, particles (containing the aroma) have to dislodge from the whiskey surface and reach our nose.
Some particles are naturally released, but both too much aroma and too little aroma are undesirable. When aroma is naturally intense it can anaesthetise the nose and sear the tongue. This natural intensity grows with increase in alcohol concentration.
When aroma is insignificant, it inhibits our natural curiosity to figure out the aroma generally resulting in an unsatisfactory feeling.
Water inhibits or increases different flavors of aroma. Dilution releases additional aroma
Water promotes a Chemical Reaction
Ice and water added to Whiskey
Source - go-rio.co.uk
Addition of water dilutes the whiskey.
Addition of ice dilutes and cools the whiskey.
Esters and long-chained hydrocarbons exist dissolved in whiskey. When water is added, the solubility of these compounds decreases and increased aroma results.
Ice promotes a different chemical reaction
Ethanol molecules aggregate in large bunches (called micelles) and this bunching traps aroma particles.
As temperature drops, these micelles breakup and with the breakup aroma particles get released.
Thus, cooling enhances flavors that define each whiskey.

Saturday, March 23, 2013

2013 - Year of New Sourcing through Imagination, Ingenuity and Invention? Why Not?

Source - un.int
On March 21st the world celebrated World Water Day 2013.
The day's theme reflected the theme already proclaimed at the beginning of 2013: Year of Water Cooperation.
World Water Day - Over the years
World Water Day has been observed since 1993.The themes for World Water Day have been:
2013: Year of Water Cooperation
2012: Water and Food Security: The World is Thirsty Because We are Hungry
2011: Water for cities: responding to the urban challenge
2010: Clean Water for a Healthy World
2009: Trans Waters
2008: Sanitation
2007: Coping With Water Scarcity
2006: Water and Culture
2005: Water for Life 2005–2015
2004: Water and Disasters
2003: Water for Future
2002: Water for Development
2001: Water for Health
2000: Water for the 21st century
1999: Everyone Lives Downstream
1998: Groundwater – The Invisible Resource
1997: The World's Water: Is there enough?
1996: Water for Thirsty Cities
1995: Women and Water
1994: Caring for our Water Resources is Everybody's Business

Source - epa.gov

World Water Day has never emphasized New Water Sources:
- How to find them
- How to tap them
- How to deliver water from them to where it is needed by humanity or by nature
This missing empasis is especially tough to accept when we know that
(a) water exists everywhere
(b) everything contains water
in either solid, liquid or vapor form
What History tells us
Source - blog author

* Over 10,000 years ago, humans dug a well to obtain freshwater from an under-ground aquifer.
* Over 7,000 years ago, humans invented irrigation to deliver freshwater to their crops.
* About 5000 years ago, humans built a 15-foot high barrier to stop a river and create a lake from which they could extract freshwater at will.
* Nearly 2,000 years ago, humans created waterwheels to raise freshwater to elevations higher than that of lakes and flowing rivers.
* Some 150 years ago, humans invented indoor piping which was soon followed by the in-home boiler to supply domestic hot freshwater.
These inventions, of course, comprise only the very top tip of the iceberg of human ingenuity applied to obtain, transport and use freshwater from known bodies of water.
None of the above actions were accidental or done without intention or taken to satisfy intellectual curiosity. All of these actions were taken in the face of adversity. The people, they are always individuals never organizations, who made these inventions had their backs to the wall of water scarcity. They had to eradicate the real possibility of everyone they knew dying from lack of fresh water.
Searching for Water is NOT a new Task
As the dates clearly indicate, our search for freshwater is not a search new for us. Throughout our history, we have repeatedly reached the uppermost limits of the amount of freshwater readily available from water sources we know, either because our numbers grew too large or drought arrived. We have on a regular basis covered the distance, literally speaking, to find new sources of adequate freshwater supplies. There is now a large body of evidence that supports the notion that freshwater scarcity was behind human migration out of Africa 135,000 years ago. Other major human migrations, like the one 9,500 years ago in Chile were also in search of freshwater.


When freshwater supplies diminish and we must find new sources of supply, the promise of human ingenuity is a historic proven success story.

2013 - The Year of Water Exploration?

Thursday, March 21, 2013

March 21, 2013 - World Water Day

Source - UN.org


    "The fulfillment of basic human needs, our environment, socio-economic development and poverty reduction are all heavily dependent on water.
    Good management of water is especially challenging due to some of its unique characteristics: it is unevenly distributed in time and space, the hydrological cycle is highly complex and perturbations have multiple effects. Rapid urbanization, pollution and climate change threaten the resource while demands for water are increasing in order to satisfy the needs of a growing world population, now at over seven billion people, for food production, energy, industrial and domestic uses. Water is a shared resource and its management needs to take into account a wide variety of conflicting interests. This provides opportunities for cooperation among users.
    In designating 2013 as the UN International Year of Water Cooperation, the UNGA recognizes that cooperation is essential to strike a balance between the different needs and priorities and share this precious resource equitably, using water as an instrument of peace. Promoting water cooperation implies an interdisciplinary approach bringing in cultural, educational and scientific factors, as well as religious, ethical, social, political, legal, institutional and economic dimensions."
http://www.unwater.org/water-cooperation-2013/water-cooperation/en/

Saturday, March 2, 2013

Lots and Lots of Water in the Atmosphere!


Total moisture in the atmosphere
In total there exists, at any one moment, 12,900 cubic kilometers of water in the atmosphere. 
Liquid water in air
98% of this moisture exists as vapor while 2% exists as liquid i.e. there are:
~ 258 cubic kilometers of water in liquid form in the atmosphere, and
~ 12,642 cubic kilometers of water in vapor form in the atmosphere
Using 1 cubic kilometer = 2.64172052 × 10¹¹ US gallons, there are:
~ 681.56 x 1011 US gallons of water in liquid form in the atmosphere, and
~ 33,396.63 x 1011 US gallons of water in vapor form in the atmosphere
Moisture in air replenishment rate
All the moisture in the atmosphere is, however, replaced every 9 days i.e. 12,900 cubic kilometers of water is delivered to the surface of the Earth from the atmosphere every 9 days i.e.
~ 681.56 x 1011 US gallons of liquid water falls on Earth every 9 days, and
~ 33,396.63 x 1011 US gallons of vapor water falls on Earth every 9 days
Water deposited on Earth from the atmosphere every day
~ 3,787 x 1011 US gallons every day
For a 10 billion human population, this is ~ 37,870 US gallons/person/day
What's behind global water scarcity?
Recognizing that ~ 37,870 US gallons/person/day is just NEW water and does not include water from rivers, lakes, underground aquifers and other sources, the question arises:
Why do we have a water scarcity issue in most places around the globe, today?
Granted, we cannot capture every, or even most, drops for humanity's use, water scarcity remains a challenge for human ingenuity in two ways: How do we capture precipitation in locations that nature chooses and how do we transport the collected water to where we want or desperately needs to have it?

Saturday, February 16, 2013

Rainfall Predictions Possible With Cell Phone Technology

Knowing how much rain falls on a location is key to determining if any unfilled thirst remains unfilled at that particular location. Unfortunately, however, knowing actual rainfall amounts has always been a very difficult task.
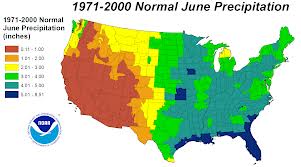
Typical Precipitation Map
Source - climatecentral.org
Resolution of data that makeup such a map is, at best, around 50 miles and is possibly as high as 100-200 miles. This data is gathered from rain gauges installed every 50, 100 or larger distances apart.
We are, however, very well aware that rainfall amounts are not usually similar or identical over a 50 mile or a 100 mile or a 200 mile square of area.
Using rainfall data from this map can lead to incorrect conclusions: thirst experienced by some farms can be overlooked, or, some farms that don't experience thirst can be targeted for additional water supply. In either case, resources expended to deliver water (safe for irrigation) will end up being misspent.
Radar Maps
Source - weathercentral.com
Doppler radar have better resolution that do rainfall data maps.
However, the installed base of Doppler radar sites are predominantly around major cities and population centers. Doppler radar, thus, provides us with high resolution rainfall maps in and around cities.
Farms or other remote agricultural locations have few of these radars and thus assessing their thirst is a problematic task
Towers (for mobile phones) may hold the answer!
For cell phones to work, microwave transmissions are relayed between individual towers. 
These microwave signals, between towers, are transmitted at a known constant strength that allows for signal decay over distance and for known weather conditions that might reasonably be anticipated. For a particular weather condition, the rate at which this signal falls off (or deteriorates) can be predicted for any set of towers.
When liquid water is in the air (i.e. it is raining), however, the signal between towers drops (is weaker) because a part of the signal is reflected off raindrops and does not make it to the next tower.
Depending upon terrain, towers can be just 1-2 miles apart.
The Netherlands Experiment
Source - lonelyplanet.com
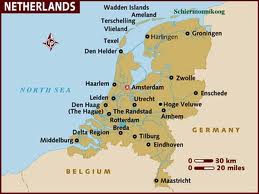
Netherlands, the country, has just 32 rain gauges, but about 8,000 mobile phone towers.
An algorithm has been developed that measures differences between normal (no rain) signal strength and signal strength when it rains.
An experiment was run, in September 2011, to see how well signal monitoring could measure actual rainfall amounts.
This test, conducted with data from just 2400 cell towers, mapped rainfall amounts very close to the measurements from a combination of radar and rain gauges.
Thirst in the Developing and Underdeveloped worlds As cell phones, and the towers that enable them, have become commonplace all over the developing and underdeveloped world, its a simpler step to use cell phone signals to measure and predict rainfall amounts in real time. The traditional alternative, involving radar and rain gauges, may not be necessary any more.

This post was inspired by an article in The New Scientist magazine

Saturday, February 2, 2013

Lightening Requires Liquid Water!

Without water in the atmosphere, there would be no lightening
Positive and Negative Electrical Charges
A Positive Charge
(A lack of Electrons)
Source - Wikipedia.org
A Negative Charge
(An excess of Electrons)
Source - Wikipedia.org
Excess or shortage in electrons determine the charge of an object.
An excess of electrons makes an object a negatively charged object.
A shortage of electrons makes an object a positively charged object.
Location of charged Water in air
Water droplets (liquid) with positive charges stay higher up in the atmosphere. Water droplets with negative charge stays lower in the atmosphere.
Separation of Charges Causes Charge Movement
Lightning is a transfer of electrostatic charges between oppositely charged regions of the sky in an attempt to equalize charges in these regions or the transfer of electrostatic charges between a cloud and the surface of the Earth.
Lightening locations
Lightning frequency map
Source - wikipedia.org
Lightening does not occur everywhere on Earth.
Most lightning occurs over land and in areas where convention currents in the air are the greatest as these currents promote separation of areas that contain oppositely charged droplets of liquid water.
The caution to stay away from water when there is atmospheric movement in charges, thus, makes excellent sense!

Saturday, January 19, 2013

Refraction Makes Water a Daylight Transmitter!

Water's refraction properties can bend sunlight, concentrate it and deliver the concentrated sunlight to areas where sunlight cannot naturally reach.
Refraction
Source
- chemicalparadigms.wikispaces.com
Refraction is the change in direction of a light wave that occurs when materials with different refraction properties transmit the light wave.
The refraction - change in direction - occurs at the point where one material meets another.
Refraction occurs when the light hits the surface of a new medium at an angle other than at 90 degrees i.e. the light does not hit the surface of the medium perpendicularly.
By putting different mediums in the path of a light ray, the ray can be bent to arrive at a location that the original ray cannot reach.
Lighting up a room in Brazil
Source - doorknob.com
Shacks with corrugated metal roofing and no electric connection are usually very dark places.
Source - doorknob.com
solar bottle installed in a hole in the roof can help.
This is a sealed bottle half full of water and installed so that the water surface in the bottle is in line with the roof's outside surface.
Source - doorknob.com
When sunlight shines on the bottle, water in the bottle captures and concentrates the light and, in effect, acts as an electricity bulb installed in the roof of the shack.
To keep the water clean, a few spoonfuls of chlorine is added to the water. This water-chlorine mixture can provide light for a number of years.

Saturday, January 5, 2013

Water Vapor - The dominant Greenhouse Gas

The Earth's atmosphere is a blanket held in place by gravity and Earth's motion. The location of the Earth relative to the sun and the greenhouse effect of the atmosphere makes Earth a hospitable place for our kind of life
The Greenhouse Effect
Source - Wikipedia.org
The average temperature on the Earth's surface is warmed to 14 Degrees C, due to the Greenhouse effect.
The Greenhouse effect is caused by the gases that make up the atmosphere.
These gases increase the temp on the surface by reflecting back to the surface a portion of the radiation energy emitted by the surface
The emitted energy is a part of the solar energy received by the Earth's surface.
Contributions to the Greenhouse Effect
Source - eesc.columbia.edu
Different gases in the atmosphere influence the greenhouse effect in different amounts.
Under a clear sky:
 Water vapor:    ~60%

   (can range between 36% and 72%)
 Carbon Dioxide:~25%
   (can range between 9% and 26%)
 Ozone:            ~8%
   (can range between 3 and 8%)
 Trace gases      ~7%
   (methane between 4% to 9%
    Nitrous oxide between 3% and 9%)

Clouds add to the greenhouse effect.


Tuesday, January 1, 2013

2013 - International Year of Water Cooperation

The United Nations General Assembly has declared 2013 as the Year of Water Cooperation

"The objective of this declaration is to raise awareness of:
a. The potential for increased co-operation, and
b. The challenges facing water management in light of the increase in demand for water access, allocation and services" - Irina Bokova, Director-General, UNESCO


To open chart in a new window, click on: http://www.unece.org/fileadmin/DAM/env/water/mop_6_Rome/Background_docs/Timeline_A3_R3.pdf
Source - unwater.org


Monday, December 31, 2012

May All Thirsts Be Quenched Everywhere


Season’s Greetings
+
 The Very Best of Wishes
For Extreme Delight and Joy
To Become Routine
For You and Yours
In Twenty-Thirteen!

Saturday, December 8, 2012

263 Rivers on Land and 1 River in the Air!

Rivers are the oldest source of freshwater for humans, most ecosystems and most living species.
River Basins
A river basin is the land area from where water drains to feed rivers. The 263 river basins of significant rivers are fed by 45.3% of the land surface area of Earth. The 26 major river basins are shown in the graphic.
26 Largest river basins on Earth
Cartographer - Delphine Digout, UNEP/GRID-Arendal
Arid Areas
The most arid areas are those that do not have enough water i.e. are areas that are not in river basins: Southern California in The US, Western and Central Australia, The Mediterranean sections of Europe, North Africa and others are the  most arid areas on Earth.
The Missing but Largest River of all
Rainfed Agricuture
Source - fao.org
When land areas that serve as river basins are compared with those where rainfed agriculture is predominant, it becomes apparent that much of the water fed into rivers is water delivered by rain.
In a manner of visualization, rain too can be seen as a river in the air or atmosphere.
As is to be expected, the river in the air differs from the rivers that are on the surface of land:
- The river in the air is mobile and is subject to the movements of air streams (that carry the water in this river) in the atmosphere. Land based rivers are, over short periods of time, fixed in space.
- The river in the air is the original river of fresh water that feeds a land-based rivers.
100% of the water in rivers on land is in liquid for, while only 2% of the water in the river in the air is in liquid form. 98% of the water in the air exists as water vapor.

It is this river in the air, that we must find a way to tap when we seek to extract water in the air we breathe.